Miasanrot
·17 June 2021
MSR awards season 20/21: Stats Corner Part 2

Miasanrot
·17 June 2021

After highlighting a number of team-level statistics in the first part of the 2020/21 stats corner series, we would now like to take a closer look at some player statistics. The focus will be on the players of FC Bayern, but we will also try to put their performances in relation to players of other clubs and leagues.
Most of the most common player statistics are only relevant with respect to a certain section of the players and do not allow for much general comparison. If we look at the number of goals scored, for example, forwards naturally perform better than defenders. Also for assists, tackles and passes, there are roles and positions that tend to perform better. Even though we will get to some of these statistics later, we will start the review with a very simple and easily comparable variable: playing time.
The following chart shows us the number of minutes played for all FC Bayern players in competitive matches in the 2020/21 season. Additionally, players who have joined the club (in green) or left the club after the season (in blue) are colored respectively. Bayern played a total of 50 competitive matches, so the maximum possible playing time is approx. 4500 minutes (this does not take into account stoppage time or late signings that arrived after the season had already started).
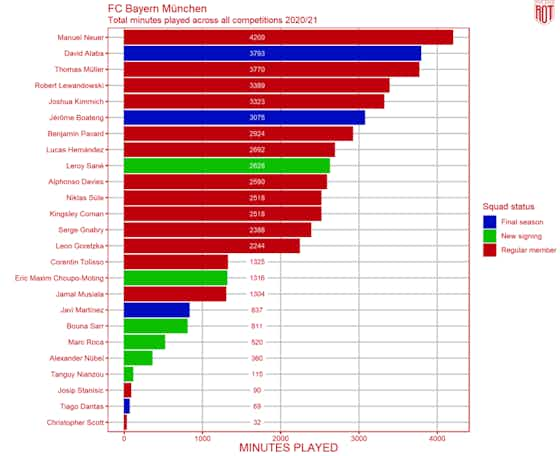
Not surprisingly, Manuel Neuer got the most playing time in the past season. Newcomer Alexander Nübel was only granted 4 starts in place of the world goalkeeper (1x Bundesliga, 1x DFB-Pokal, 2x Champions League).
In second place among the players with the most minutes is David Alaba. As already pointed out in an earlier article, Bayern have lost a key player with him. Jérôme Boateng follows a few places behind Alaba, but still has accumulated over 3000 minutes. FC Bayern will certainly miss him as well.
Müller, Lewandowski, and Kimmich round out the top 5. All three were mainstays of the team’s success and not surprisingly end up in the top section of the chart.
Yet a look at the chart reveals even more. The clearly visible drop in playing time from position 14 to 15 shows that Hansi Flick did not use eleven players only, but also did not rotate excessively. Taking into account the special circumstances (Tolisso was injured for a long time, Musiala was slowly introduced to the first team and Choupo-Moting had a certain Robert Lewandowski ahead of him), one can probably identify 18 players who played a bigger role in the coach’s plans. The fact that of the seven new arrivals (Tiago Dantas is both a new arrival and a departure) only two players are among these 18 is certainly not ideal. On the other hand, most of them were only signed as replacements (an exception to this could be Marc Roca, who will hopefully get more playing time under Nagelsmann).
Judging the quality of a player purely based on their playing time is certainly not enough. Especially because external factors such as injuries and suspensions also have an impact here. The following chart therefore shows the proportion of games in which a player was available and used (in red) in relation to the total number of games for which he would have been available (red+green). Injuries (light blue) and suspensions (dark blue) are not included in this calculation. Also, there is no distinction made between a 5-minute appearance and an appearance over the full 90 minutes.
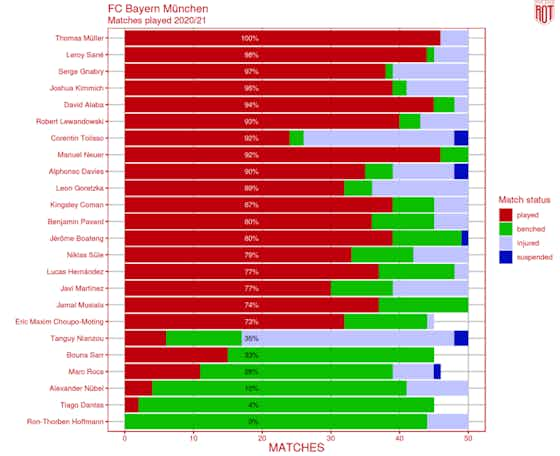
Even more clearly than in the previous chart, it now becomes apparent which 18 players were central for Flick. There are also strong effects from injuries (Tolisso was used in 92% of the games in which he was available) and minutes played (Choupo-Moting, Musiala, Martínez and others were used in over 70% of the possible games, but often only for a limited amount of time).
In addition to Tolisso, Müller’s 100% use and Sané’s very high appearance rate are certainly noteworthy. At the other end of the scale, Marc Roca was not given a run out in 72% of the matches for which he would have been available.
The only players who did not miss a single game due to injury were Neuer, Boateng, Sarr, and Dantas (we count Corona-related absences as injuries for purposes of this analysis).
Although playing time is a great metric as it allows for a fair comparison of all players, goals are still the deciding factor in any football match. Therefore, in the following we also take a look at goals and assists: i.e. goal participations.

The chart above shows all goal involvements in competitive matches on the vertical axis. For better comparability, the number of involvements is divided by the playing time and extrapolated to a full 90 minutes. Robert Lewandowski, with a value of approx. 1.5, is therefore involved in an average of one and a half goals per game (more precisely: per 90 minutes played). The playing time is plotted on the horizontal axis. If we multiply the playing time by the number of goals per 90 minutes, we get the absolute number of goal involvements. Levels of equal height are shown in grey. In addition, the number of goals and assists [G/A] is shown in brackets behind each player’s name.
Robert Lewandowski obviously stands out. An impressive 57 goal participations set him far apart from the rest. Thomas Müller is also in a league of his own with 15 goals and 24 assists. His rate per 90 minutes is not quite as clearly above those of Coman, Sané, Goretzka or Gnabry; however, due to his significantly higher playing time, he has a far higher yield in absolute terms.
The differences between the three most used wingers are only slight. Coman scores fewer goals than his two contenders, but has more assists. Gnabry has the most goals of the three, but the fewest assists, and Sané is somewhere in between the two. Also noteworthy are Goretzka and Kimmich, who both have a similar number of goals as the three nominally more offensive wingers.
As has often been mentioned, however, these statistics are not very meaningful in and of themselves. A comparison with other players in the top five European leagues can help to put the numbers into perspective.
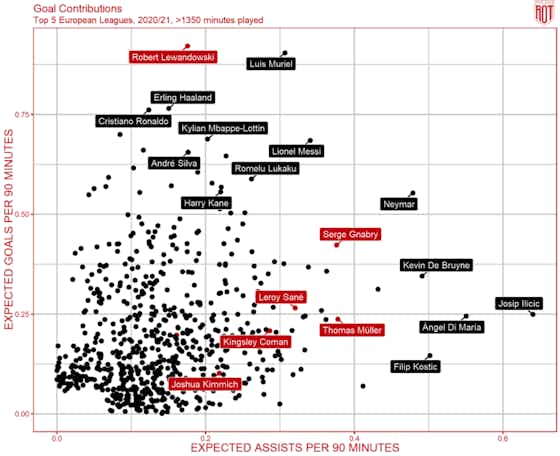
Instead of looking at actual goals and assists as before, we now switch to expected goals and expected assists (see also the brief explanation of “Expected Goals” in Part 1 of the series). Expected assists follow the same pattern as expected goals: For example, if Coman sets up an xG 0.5 goal from Lewandowski with a cross and Lewandowski scores, Coman gets 0.5 expected assists for this.
The above graph thus shows the expected goals per 90 minutes on the y-axis and the expected assists per 90 minutes on the x-axis. Unlike in the previous graph, however, the numbers are now not set in relation to playing time. This is important to emphasize because standardising the values to 90 minutes can lead to strange results: For example, if a player’s only appearance in a season is a one-minute appearance that results in a goal, that player would average 90 goals per 90 minutes. To exclude such outliers, only players who have played at least 1350 minutes are included here.
Unsurprisingly, Lewandowski is still top in an international comparison. Even if Luis Muriel of Atalanta Bergamo is close on his heels. Gnabry’s output is also impressive. In addition to the change from actual goals/assists to expected goals/assists, only performances in the respective domestic leagues are considered here. This is the reason for Gnabry’s improvement compared to the previous observation. On the one hand, he had the majority of his goal involvements in the league (while Sané, for example, also scored several times in the CL and the Club World Cup) and, on the other hand, his actual assists in particular remained significantly below the expected assists, for which there are a variety of reasons, not all of which necessarily lie within the control of the player himself.
In addition to the international comparison, let us also take a brief look at recent club history.
The following chart shows FC Bayern’s wingers of recent times as well as Thomas Müller and depicts the number of goal involvements for each season. In addition, the grey bars show the percentage of playing time.
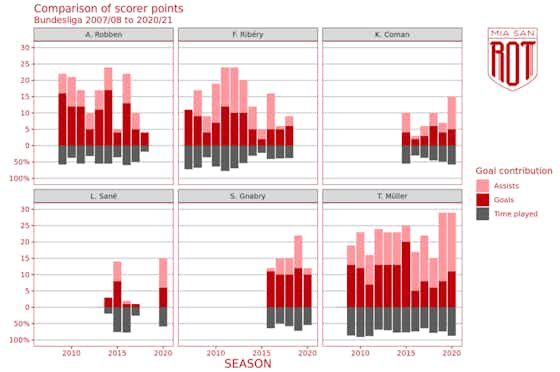
Like most comparisons with past seasons, this past one tells many different stories: Stories of the incredible consistency of Thomas Müller, his transformation from goalscorer to assist maker, the year-long dominance of Robben and Ribéry, Coman’s ever-increasing influence or the prolific goal scoring of Serge Gnabry.
However, as this article is mainly intended to highlight the past season, we are happy to leave it to the reader to find more stories at this point.
After this array of quantitative statistics, we also want to take a look – at least briefly – at a somewhat more qualitative assessment of the players. In contrast to the above figures, in theory at least the bias favoring certain positions and roles could be less pronounced here and thus a comparison between e.g. strikers and defenders made more easily (whether this is the case in practice, I do not want to judge here).
For the following chart, we have calculated the average scores of the Kicker, transfermarkt.de and Ligainsider. The red dot stands for the Kicker’s grade, the black bar spans the spectrum from the best grade of the three sources to the worst.

Considering only the Kicker’s marks, some clusters form. Robert Lewandowski is in a league of his own; he is followed by Goretzka, Neuer, Müller and Kimmich, four other key players. Coman leads the pack in midfield, but Sané and Süle find themselves in the lower end of the scale. In the case of Sané in particular, this assessment seems surprising given his statistics mentioned before. Presumably, the very high expectations at the time of his move to Munich also play a role here.
With some players, it becomes clear how subjective player ratings are. The Kicker sees Manuel Neuer and Leroy Sané at the upper and lower end of the grading scale, respectively. If we include the grades from Transfermarkt and Ligainsider, Sané could even be ahead of Neuer.
This subjectivity in the observation could arguably be expected. Perhaps the respective sources can at least agree on which player performed better or worse compared thave vo the previous season? To do this, we have compared the scores shown above with those for the 2019/20 season. In red we show the change in the Kicker grades and by means of the black line the spectrum between the biggest positive and biggest negative change of the three sources. As it is the simple difference of the grades, a negative change means an improvement compared to the previous season.

As before, there is a large discrepancy between the various sources. With the exception of four players, it does not seem clear whether players had played better or worse this season than in the previous one. At least for Boateng, Alaba, Pavard and Davies there seems to be agreement that their performances this season were weaker than the previous one. The fact that the first two players will now leave the club may be worth mentioning, at least in terms of salary negotiations and the club’s standing. The sharp decline in day-to-day performance of Pavard and Davies, especially in comparison to exceptionally strong performances in the previous season, has probably been noticed by everyone who actively followed FC Bayern games.
We cannot conclude this article without mentioning one man. One who can rightly call himself FIFA World Player of the Year: Robert Lewandowski.

The graph above does not need much explanation. It shows the Pole’s scoring record compared to that of Gerd Müller’s record season in the 1970s. After a phenomenal start, Lewandowski threatened to come up just short at the end – especially due to a lengthy injury layoff. In the – literally – last minute against Augsburg, however, he managed to score the goal that gave him the sole record: 41 goals in only 29 games.
All in all, there have been many outstanding achievements by FC Bayern in the last season. First and foremost, of course, there are Robert Lewandowski’s 41 goals. However, there are also some question marks that only the next season will be able to give the answer to:
Will Sané finally find his way back to the performance that almost made him a €100m transfer? Can Pavard and Davies put their disappointing year behind them and build on the performances of the treble winning season? Can Tolisso finally have a season without major injury worries (or will he even move on)? Will Marc Roca get a chance to prove himself on the pitch for new coach Nagelsmann? Can Lewandowski even come close to repeating the performances of the last two years? Who will replace David Alaba on and off the pitch? How will Upamecano be able to bed into the team structure?
Before we can start to find answers to many of these questions, we still get to admire some of the players at the current European Championship.
In the last part of this series, we will soon take a look at the FC Bayern women’s season, which, after an outstanding season, secured the next championship title for the club.


